
Agriculture · Agricultural companies
Data analytics for agriculture: field decisions with same-day data
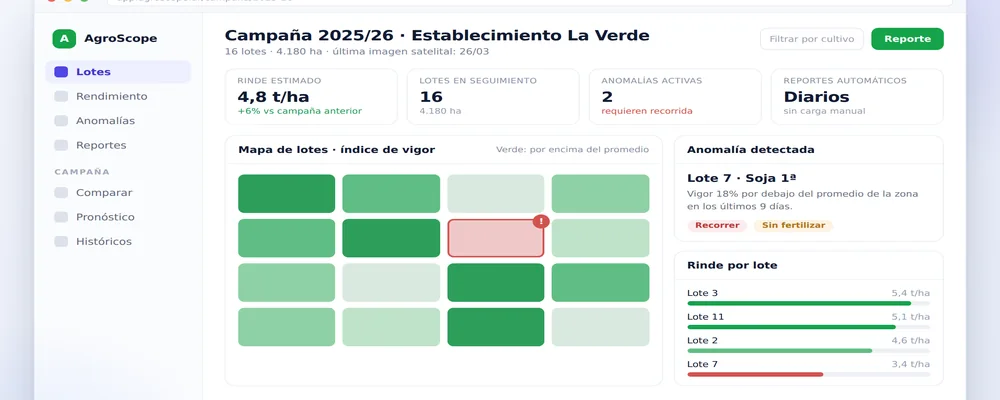
Real-time dashboards, geospatial analysis, and early deviation detection, so decisions no longer rely on last week's field visit.

- Client
- Agricultural companies
- Sector
- Agriculture
- Product
- AgroScope
In numbers
The initial problem
Scattered production and geospatial data made it impossible to make operational decisions with predictability or to detect in time what was failing in each field.
The previous process
Production information was gathered through field visits and manual reports, and deviations were detected once they had already affected the season.
The solution implemented
Real-time dashboards, automatic reporting, early evaluation of production anomalies, benchmarking between fields, and an AWS architecture for geospatial analysis and yield forecasting.
How we did it
Consolidating sources
We unified the production, geospatial, and season data that lives scattered across spreadsheets, systems, and field visits.
Data architecture on AWS
We set up the pipelines and geospatial processing on AWS, with reporting that generates itself.
Anomaly detection and benchmarking
We defined what counts as a deviation for the operation and enabled comparison between fields to explain why one yields differently than another.
Yield forecasting
Models that anticipate expected yield and allow resources to be assigned with predictability before the season closes.
Integrated systems
- AWS
- Dashboards
- Geospatial data
- Automatic reporting
The result
Fewer unproductive field visits, better resource allocation, and greater operational predictability across the season.
What changed in the operation
- Field visits target the plots showing deviations.
- Season reports generate themselves.
- Comparison between fields explains yield differences.
- Resource decisions are made with forecasts, not intuition.
Frequently asked questions about this case
Does it work if our data is in spreadsheets?
Yes. Part of the work is precisely consolidating spreadsheets, systems, and field surveys into a single reliable base.
What do we need to get started?
Data from recent seasons and the team's production criteria. That's enough to build the first dashboard and define what counts as an anomaly.
Does it integrate with the systems we already use in the field?
Yes, the architecture takes existing sources by API or file, without forcing a change of tools.
Keep exploring
Other work by the team, across different sectors.
 Energy
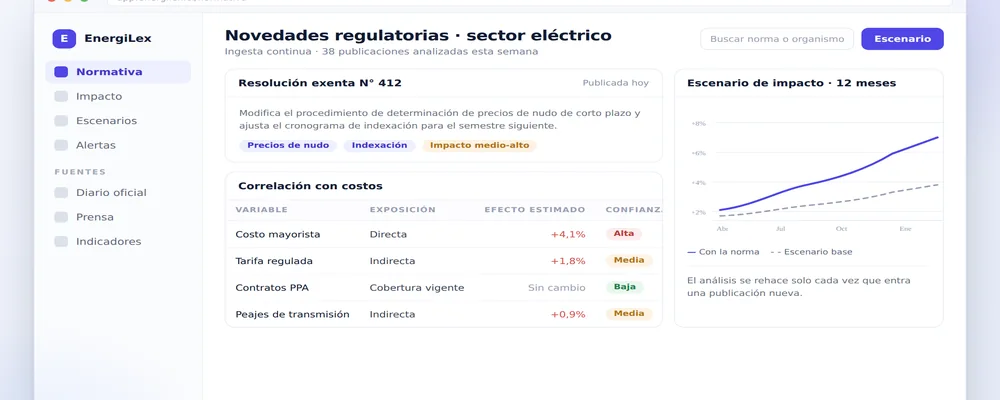
AI applied to energy regulation: anticipated regulatory impact
Continuous ingestion of legislation, news, and socioeconomic context, with models that anticipate the impact on costs.- Continuous regulatory ingestion
- Correlation with costs
- Impact scenarios

 Industry
Industrial vision for defect detection
Computer vision to detect microscopic defects and a RAG platform to query manuals and technical documentation.- Anomaly classification
- Traceability per part
- Technical documentation queries

 Accounting
Accounting automation with AI and tax filings
A workflow that receives, reads, validates, and files the firm's source documents with no typing, plus missing-item alerts per client.- Reading with OCR and AI
- Validation against ARCA and banks
- Alerts for missing documentation
Tell us which process you'd like to improve
We'll look at how it works today and send back a concrete diagnostic: what to automate, how, and what result to expect. No cost, no commitment.