
Finance · Arcos Capital
Arcos Capital: financial data traceability and automated reports
Reports build themselves from the company's own sources, and every figure stays linked to the file and the moment it came from.
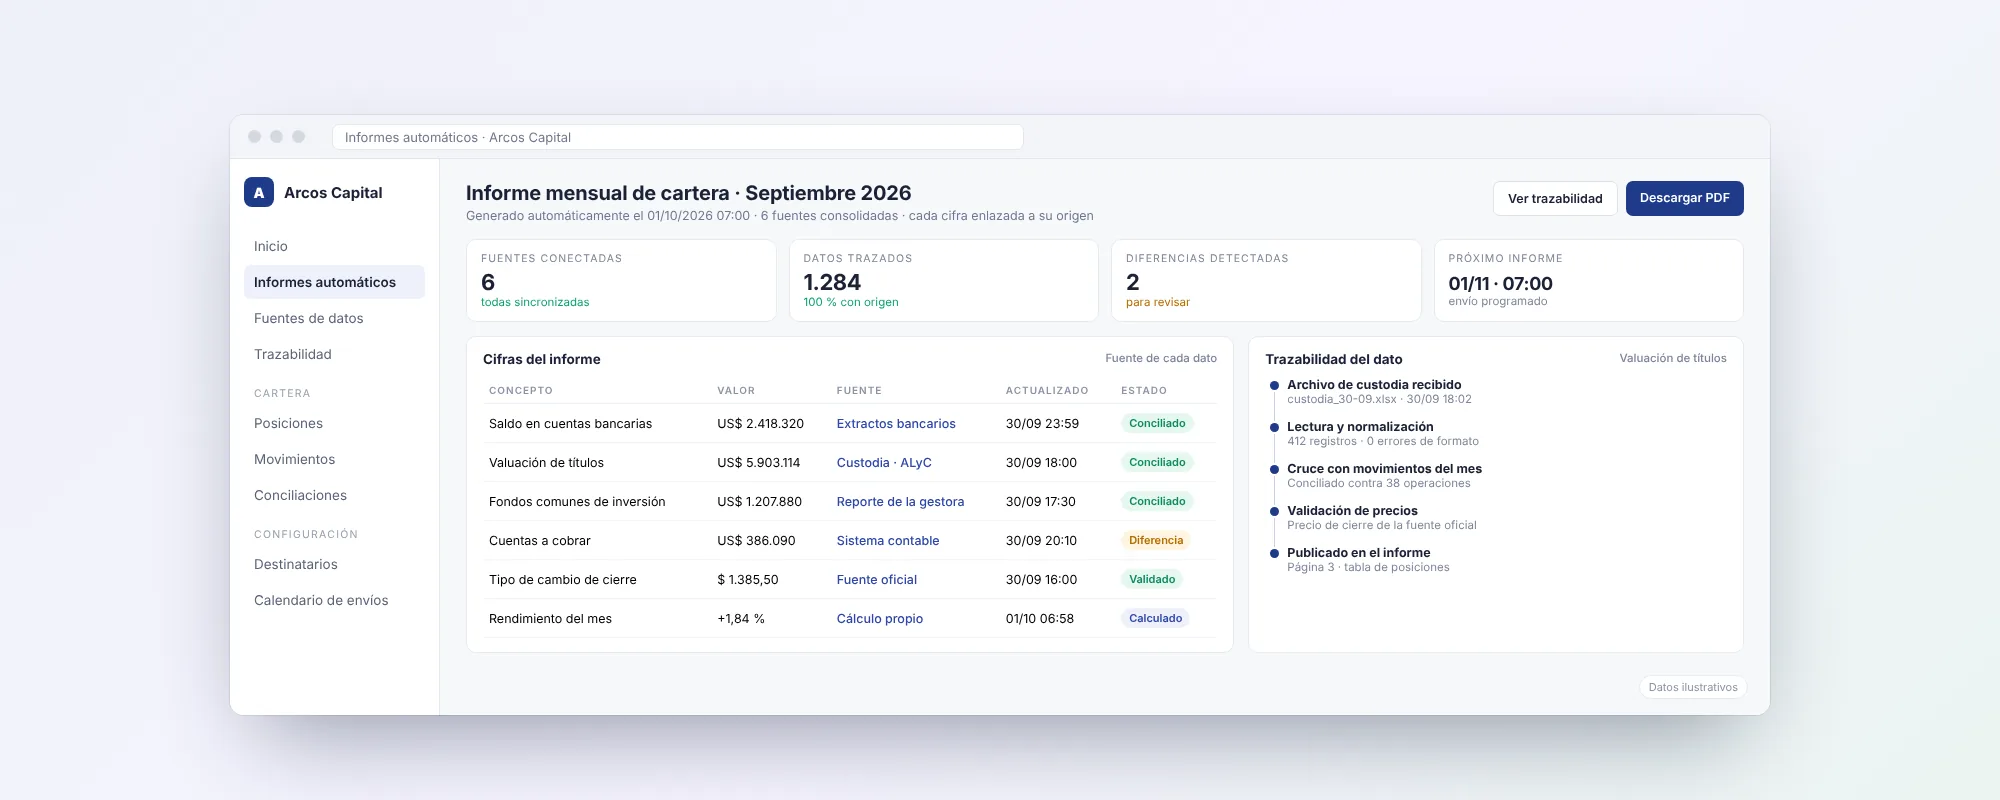
- Client
- Arcos Capital
- Sector
- Finance
- Product
- Arcos Capital
In numbers
Cost model
Behind the number: 288 h/yr of analyst time freed from report building
Data provenance. Hours freed: measured with the client over the monthly reporting cycle. Costs, rates and alternatives: model rebuilt by Possition with the assumptions in this table.
- Upfront investment
- $8,260
- Net annual benefit
- $6,048
- Payback
- 16 months
- 3-year NPV at 10%
- $6,780
- 3-year ROI
- 120%
See the full cost breakdownAssumptions, baseline, investment, run cost and benefit
Assumptions
| Reporting cycle | Monthly management and portfolio report pack |
|---|---|
| Hours per cycle before | 26 h (9 data pulls, 8 reconciliation, 6 build, 3 corrections) |
| Hours per cycle after | 2 h of exception review |
| Analyst loaded cost | $26/h (salary + burden, client's market) |
| Blended build rate | $52/h, nearshore team |
| Discount rate / horizon | 10% per year / 3 years |
| Item | USD |
|---|---|
| Analyst hours on reporting312 h/yr × $26 | $8,112 |
| Total per year | $8,112 |
| Item | USD |
|---|---|
| Discovery sprint (fixed fee) | $1,500 |
| Build: 130 h × $52 | $6,760 |
| Total one-time | $8,260 |
| Item | USD |
|---|---|
| Cloud and storage | $420 |
| AI document processing | $180 |
| Managed service (monitoring and source changes) | $840 |
| Total per year | $1,440 |
| Item | USD |
|---|---|
| Hours freed: 288 h × $26 | $7,488 |
| Total per year | $7,488 |
Opportunity cost: the alternatives we evaluated
Before building, we priced every reasonable way to solve the problem, including doing nothing. The chosen option has to beat the best alternative, not just the status quo.
| Option | Upfront | Annual cost | 3-year total cost of ownership (lower is better) | Assessment |
|---|---|---|---|---|
| Keep the manual process | $0 | $8,112 | $24,336 | No traceability and ongoing copy-paste risk. |
| Delegate to a junior analyst (0.25 FTE) | $1,040 | $6,552 | $20,696 | Frees the senior analyst, but errors and cost scale with volume. |
| BI tool + manual consolidation | $3,120 | $4,248 | $15,864 | Better dashboards, but 12 h/month stay manual and untraceable. |
| Automation with traceabilityChosen | $8,260 | $2,064 | $14,452 | Lowest total cost, and every figure linked to its source. |
Opportunity cost
The best alternative ruled out was BI plus manual consolidation, at a 3-year total cost of $15,864: that is the opportunity cost of the decision. Automation costs $14,452 over the same period ($1,412 less), cuts residual manual work from 144 to 24 h/yr and adds traceability, which the BI option didn't solve.
Decision
With an $8,260 investment and $6,048 in net annual benefit, payback is 16 months and the 3-year NPV is $6,780. The dollar savings are modest and the control gain is large: the real value is that the analyst spends those 288 hours on analysis, and no figure ships without a source.
US reference: at a $63/h loaded cost for a financial analyst, the same 288 hours are worth $18,144 a year and payback drops to about 6 months.
Headline metrics are validated by the client. The cost model is a reconstruction by Possition using the assumptions shown; it is illustrative, not an accounting audit. Run your own numbers in the ROI calculator, or walk through them with us in a discovery call.
The initial problem
Building financial reports took hours of copying data from different sources into spreadsheets, and any question about a figure meant rebuilding by hand where it came from.
The previous process
Information arrived in files and reports from different origins. The team downloaded it, organized it in spreadsheets, cross-checked the numbers, and built the report by hand, with the risk of copy errors and no record of which version of each data point was used.
The solution implemented
An automated pipeline that takes information from the sources Arcos Capital already uses, reads and normalizes it, cross-checks the data, and generates the reports on schedule. Every figure in the report keeps its lineage: which source it came from, when it was updated, and which checks it passed. If two sources disagree, the system flags it for review before publishing.
How we did it
Mapping sources and reports
We documented which reports are built, with what data, and where each data point comes from, to automate the real process rather than a theoretical one.
Connection and normalization
We connected the company's sources and brought all data into the same format, logging the version and time of every load.
Cross-checks and traceability
Each data point is validated against the other sources. Anything that does not reconcile is flagged, and every published figure keeps its path back to the origin.
Reports and scheduled delivery
Reports are generated and sent automatically on the set date, ready to review and share.
Integrated systems
- Arcos Capital's own sources
- Source spreadsheets and files
- Reconciliation engine
- Report generator
- Scheduled delivery
The result
Financial reports built without manual copying, where any figure can be explained in seconds, with its source and history.
What changed in the operation
- Reports are generated automatically on schedule.
- Every figure shows which source it came from and when it was updated.
- Differences between sources are caught before publishing.
- The team spends its time on analysis, not on building spreadsheets.
Frequently asked questions about this case
What does financial data traceability mean?
That every number in the report can be followed back to its origin: the file or system it came from, when it was updated, and the checks it passed.
Does the company have to change its systems?
No. The automation works with the sources the company already uses and connects them.
What happens if two sources disagree?
The system flags the difference so a person can review it before the report is published.
Keep exploring
Other work by the team, across different sectors.
 Finance
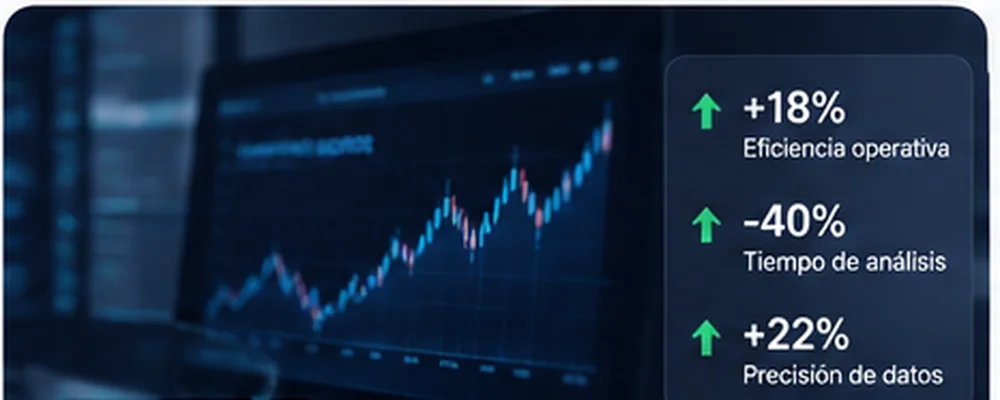
AI for finance: market data in real time
Automatic ingestion of market sources and a RAG agent to query assets, scenarios, and context in natural language.- Multichannel ingestion
- Natural language queries
- Answers with sources

 Accounting
 automation with AI and tax filings
A workflow that receives, reads, validates, and files the firm's source documents with no typing, plus missing-item alerts per client.- Reading with OCR and AI
- Validation against ARCA and banks
- Alerts for missing documentation
 Tourism
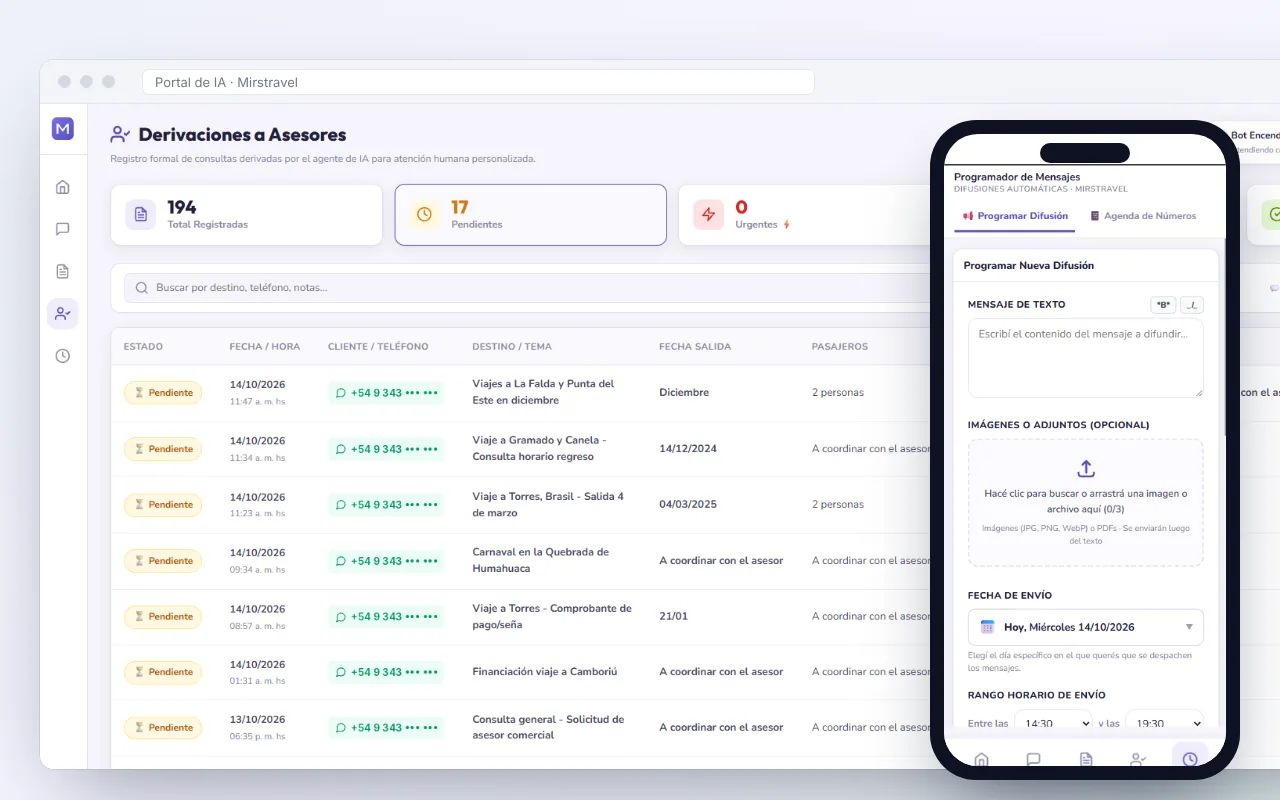
Mirstravel: an AI agent that answers, quotes, and hands off travel inquiries on WhatsApp
Mirstravel answers and quotes travel inquiries on WhatsApp at any hour; the advisor gets each inquiry already organized in a panel.- 24/7 answers on WhatsApp
- Handoffs with the full record
- Scheduled broadcasts
Tell us what you need to solve
In a 30-minute discovery call we review the process, the systems and the numbers, and tell you what's worth building, what isn't, and what return to expect. No cost, no commitment.