
Industry · Semiconductor industry
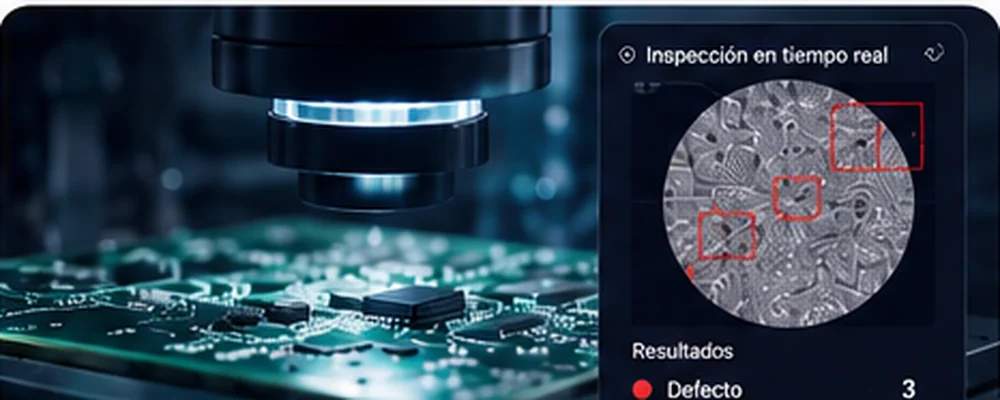
Industrial vision for defect detection
Automatic anomaly classification in production and technical documentation answered in seconds, without depending on one expert.
Team experience: a project delivered by Possition engineers as part of a Globant team. It is not a Possition client engagement; we show it because the same people and the same practice work on your project.

- Client
- Semiconductor industry
- Sector
- Industry
- Product
- Inspectra IQ
In numbers
Cost model
Behind the number: 98.7% precision in defect classification
Data provenance. Team experience: a project delivered by Possition engineers as part of a Globant team (not a Possition client). Precision measured on the project's validation set; capacity (1.40x) and time per unit (−29%) reported by the team. Costs and alternatives: illustrative model rebuilt by Possition.
- Upfront investment
- $36,340
- Net annual benefit
- $44,476
- Payback
- 10 months
- 3-year NPV at 10%
- $74,265
- 3-year ROI
- 267%
See the full cost breakdownAssumptions, baseline, investment, run cost and benefit
Assumptions
| Inspection team | 3 QA technicians, 1,840 productive h/yr each |
|---|---|
| Technician loaded cost | $32/h |
| Other subprocess costs | $128,000/yr (microscopes, cleanroom allocation, consumables) |
| Units flagged as defective | 18,000 per year |
| False rejects | 6.0% with manual inspection → 1.3% with the model (98.7% precision) |
| Cost of a false reject | $14 (re-inspection or scrap) |
| Discount rate / horizon | 10% per year / 3 years |
| Item | USD |
|---|---|
| Inspection labor5,520 h × $32 | $176,640 |
| Other subprocess costs | $128,000 |
| False rejects1,080 × $14 | $15,120 |
| Total per year | $319,760 |
| Item | USD |
|---|---|
| Discovery sprint (fixed fee) | $2,500 |
| Vision pipeline + RAG: 520 h × $52 | $27,040 |
| Cameras and GPU workstation | $6,800 |
| Total one-time | $36,340 |
| Item | USD |
|---|---|
| Cloud inference and RAG platform | $7,800 |
| Managed MLOps (drift monitoring, quarterly retraining, labeling) | $10,800 |
| Total per year | $18,600 |
| Item | USD |
|---|---|
| Inspection time freed: 1,601 h × $32−29% per unit = 1.40x capacity | $51,232 |
| False rejects avoided: 846 × $14 | $11,844 |
| Total per year | $63,076 |
Opportunity cost: the alternatives we evaluated
Before building, we priced every reasonable way to solve the problem, including doing nothing. The chosen option has to beat the best alternative, not just the status quo.
| Option | Upfront | Annual cost | 3-year net value (higher is better) | Assessment |
|---|---|---|---|---|
| Hire a fourth technician | $0 | $58,880 | $0 | Adds 1.33x capacity at its own cost; no precision gain. |
| Off-the-shelf rule-based AOI system | $120,000 | $14,000 | $38,592 | More capacity, but 96% precision, recalibration per product and no documentation search. |
| Custom computer vision + RAGChosen | $36,340 | $18,600 | $97,088 | Highest net value, 98.7% precision and searchable technical knowledge. |
Opportunity cost
The best alternative ruled out was the commercial AOI system, with a 3-year net value of $38,592. That is the opportunity cost of the decision. The custom solution generates $97,088 over the same period: an economic profit of $58,496 above the best alternative, with a third of the upfront investment.
Decision
$36,340 invested and $44,476 in net annual benefit: payback in 10 months, a 3-year NPV of $74,265 and a 3-year ROI of 267%. Excluding quality, labor savings net of run cost equal 10.7% of the subprocess's total cost, in line with the 10% reported for the project.
US reference: with a QA technician at a $38/h loaded cost, the 1,601 hours freed are worth $60,838 a year.
Precision and KPIs were reported by the project team. The cost model is an illustrative reconstruction by Possition using the assumptions shown, not an accounting audit.
The initial problem
Microscopic defects, inspections that do not scale, fragmented technical information, and slow answers to specialized questions in high-precision environments.
The previous process
Quality inspection depended on manual review, and technical knowledge was scattered across manuals, PDFs, and presentations that only a few experts knew well.
The solution implemented
Computer vision for anomaly classification with advanced visual analysis models and a detection pipeline, plus a RAG platform on Google Cloud to query technical documentation, PDFs, PPTX files, and manuals in natural language.
How we did it
Visual detection pipeline
We built the image capture and analysis workflow to classify anomalies in parts where the defect is microscopic.
Classification models
We trained and tuned the models with the plant's quality criteria, so classification reflects what the team considers a defect.
Queryable technical knowledge
We indexed manuals, PDFs, and presentations in a RAG platform on Google Cloud to answer specialized questions in natural language.
Integrated systems
- Computer vision
- Google Cloud
- RAG
- Technical documentation (PDF/PPTX)
The result
Better early detection, fewer unidentified errors, quality traceability, and fast access to knowledge without depending on a handful of experts.
What changed in the operation
- Defects are detected before moving further down the line.
- Inspection leaves a record per part and is auditable.
- Technical knowledge is no longer only in the experts' heads.
- Specialized questions are answered in seconds.
Frequently asked questions about this case
Does it replace the quality inspector?
No. It automates systematic review and flags what's doubtful so the specialist spends time on the cases that truly require it.
Does it need many images to work?
We work with the plant's own material and tune the model to its quality criteria. The pipeline is designed to improve as cases accumulate.
Does documentation search work on old manuals?
Yes. The RAG platform indexes existing PDFs, presentations, and manuals, with no need to redo the documentation.
Keep exploring
Other work by the team, across different sectors.
Intelligent traceability for the public sector
Field evidence capture with edge computing and computer vision, plus oversight dashboards with full traceability.- OCR of plates and vehicle type
- Geo-referenced evidence
- Oversight dashboards
 Agriculture
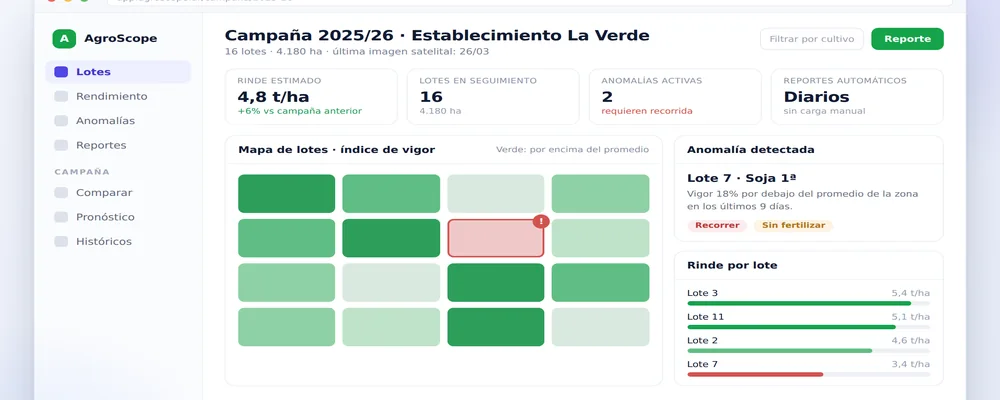
Data analytics for agriculture: field decisions with same-day data
Production and geospatial data turned into season dashboards, with early anomalies and comparison between fields.- Early anomalies
- Benchmarking between fields
- Yield forecasting
 Tourism
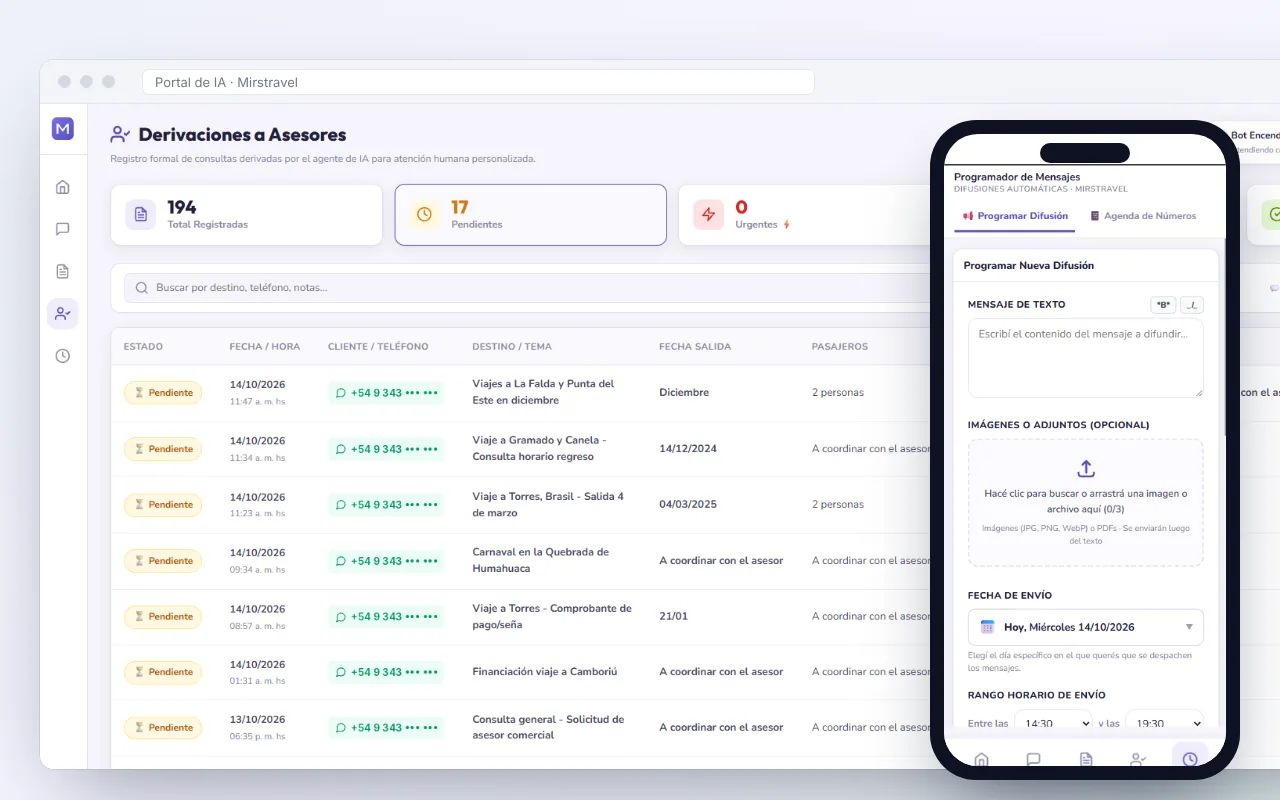
Mirstravel: an AI agent that answers, quotes, and hands off travel inquiries on WhatsApp
Mirstravel answers and quotes travel inquiries on WhatsApp at any hour; the advisor gets each inquiry already organized in a panel.- 24/7 answers on WhatsApp
- Handoffs with the full record
- Scheduled broadcasts
Tell us what you need to solve
In a 30-minute discovery call we review the process, the systems and the numbers, and tell you what's worth building, what isn't, and what return to expect. No cost, no commitment.